


Are Pro CS Teams "Worse" In 2023?
Comparing some of the pre-COVID teams to later teams to determine whether partner team "inbreeding" is a statistically observable phenomenon.

Preamble
As of writing this, CS2 has replaced CS:GO and ushers in a new era of Counter-Strike, and future prospects of Valve’s “Level Playing Field” ruling leave the long term future of competitive CS unclear yet exciting. However, for the past few years, the professional scene has not been without problems. Many pundits and fans alike say that the teams have been struck with stagnation and a level of complacency which is sufficiently different (and perhaps worse in comparison) to “pre-COVID” competition.
The last CS:GO Major was perhaps the most notable piece of evidence in this claim; with one of the lowest ranked teams, GamerLegion, making it to the final, while expected favourites like Heroic and G2 unable to meet those expectations on the most important stage, leaving upset teams like Into The Breach in the playoffs.
This is the surface level observation - that the teams are less skilled, or not as dominant. The next level of analysis claims that this is due to an abundance of low-stakes matches in leagues like ESL’s Pro League and BLAST’s Spring/Fall group stages, where partnered teams will often face the same opponents too frequently and thus limit the potential for innovation - what I’ve grown to call “inbreeding” in professional CS.
So I had a thought - what if I compared some top teams in 2018-19 versus 2022-23, and looked at the frequency of all their opponents? Most people have just been claiming it is the case based on anecdotal evidence and eye tests, which certainly have merit, but there has to be some statistics behind it if so many people are saying it - so here’s what I found. Check my Twitter for my thoughts as they come out!
The Red Herrings And Tidbits
Before going over something I think I did learn, here’s some interesting things, either preconceptions that I had which are insufficiently true, or important facts to note before the main course.
Variety of teams is relatively constant despite varying sample sizes
The three teams I tested (NaVi, Astralis, Liquid) in 2018-19 versus the teams in the recent years (Heroic, G2, FaZe) played twice as many series in 2018-19 (even though 2023 isn’t over yet, it’s an insurmountable stats barrier).
Despite this - there’s no real difference between the amount of unique teams any of these teams face.

The slight outlier is Team Liquid, because of the regional competition in North America which adds a bunch of teams they wouldn’t otherwise face.
I assumed this would be strikingly different, especially between eras of time, but it seems variety is a static component - at least, there’s nothing to say about the absolute number of unique opponents.
G2 and Vitality, A Love Story
There have been few outliers in terms of frequency of opponents faced - even the long standing Astralis and Liquid rivalry in 2018-19 is not a strong outlier for either team’s most played opponents. However, for some reason, Vitality is G2’s most played opponent by a strangely large amount - and it makes things like this graph look weird.

So for similar graphs like these, I take G2’s 2nd to 16th instead of their 1st to 15th - but for the gradients and deviations, this is not ignored. It was worthy of comment, because it’s simply weird that over 11% of G2’s games since 2022 have been against Vitality (and I would say none of them are very memorable).
The Findings - Are The Teams Inbreeding?
For those of you who can only comprehend images, and want to parade your opinions around without reading and understanding things, here’s a nice and shiny graph!

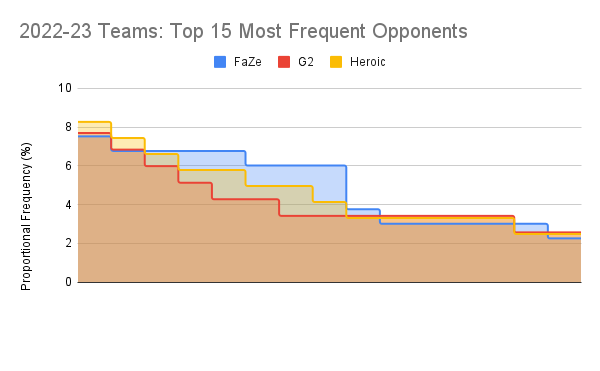
Well, I lied. These graphs are pretty hard to comprehend at first glance, but I’ll explain what they are, and then give you the actual “smoking gun”, so to speak.
I divided the number of series played by a particular team by the total series they played for a proportional frequency (the Y axis), and the X axis is the teams in order of frequency (omitted for readability). Looking at this, I vaguely saw a steeper graph in the old teams versus the new teams, but these graphs alone are insufficient…so what about the gradients of the series played?

Now that’s a statement in bar chart form! What does it mean?
This is the slope of “series played against ranking amongst top 15 most frequently played opponents”. In simple terms, this number is the reduction in games played as you go from 1st most frequent to 2nd, 3rd, etc.
What that means is that amongst the set of teams that Astralis and Liquid played against often in 2018 and 2019, there is a stronger difference between the more frequent teams and less frequent teams on that list. If you think about tournaments, this makes sense! There are two teams in a grand final - four in a semi final - and so on. The dropoff should be noticeable, especially for teams that went far in events like the two teams I mentioned.
For FaZe, G2, and Heroic, this paints a drastically different picture. It means that there is not much of a dropoff between the 1st and 10th most frequently played team on their list. It’s not just that they play against the same teams - but that they play against the same teams a similar number of times.
Astralis and Liquid played against each other a lot in their best years, but the complaint was specific to that matchup - now, it’s that everything seems sameish. NaVi in 2018-19 brings an interesting insight, as a team that was not very dominant but did win from time to time - their number is closer to 2022-3’s teams. Essentially - the best teams from nowadays have more sameish opposition than a good team from 2018-19.

Here’s another way of looking at it - the standard deviation, a measure of variability. This fairly clearly shows what I’m talking about - the variability of the teams that the best squads of 2022-3 play against frequently is simply less than what it was in 2018-9.
So…is this the proof?
Unfortunately, it’s not an objective answer, unless you simply want to take the shiny graph and run with it. Technically all this says is that some of the best teams of today play other teams about the same amount, whereas the best teams played other teams with more variance. It’s impossible to actually prove whether teams are worse or better because that’s an opinion - all I can do is make the jump between the ones and zeroes and say what I think.
I think this: teams play each other in a much more ‘bubble’ way compared to the earlier years. If this article had a larger scope and I had access to the data directly instead of scraping manually (which is why the pistol round article will be in limbo…), I would have done this for every team and formed some sort of edge weighted graph in order to prove that the “network” of professional CS teams is denser and more evenly spread amongst the teams we see most often, compared to the earlier years.
It’s a good sign of what people have observed - but more would be required to be truly conclusive.
Afterwords
If you’ve made it to the end of this article, thanks for reading! Although this article kind of pushed the “once a month” goal I have had, the idea struck me and it bore fruit in a fantastic way.
If you’ve got some abstract ideas that might warrant investigation, let me know! I think I’ll have some opinion pieces on CS2 and future predictions coming soon. In the meantime, I’ve been doing some Twitch streaming and uploading VODs to YouTube, so if you want some other stuff besides pure CS articles check it out!